
Did the pilots result in mode shifts?
An important objective of the evaluation research was to understand whether provided services were replacing other modes that might be less safe, efficient, or environmentally friendly.
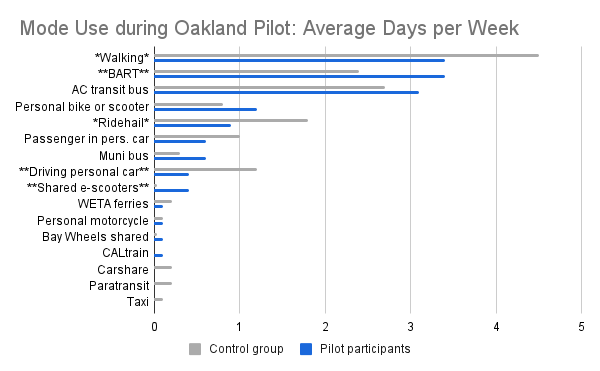
* differences significant at p < .10, ** p < .05, two-tailed
For example, will people take the train instead of driving their car, or replace a long circuitous bus commute with more direct ride on a train or other mode? This is called mode shift, and is demonstrated in Figure 3.
Oakland pilot participants did report driving a personal car less compared to the control group. On the other hand, they reported using BART and shared e-scooters more, suggesting some mode shifts did occur. Mode shifts were also observed in Bakersfield, particularly lower use of ridehailing when participants had access to Spin scooters and bikes. Bus use among Bakersfield participants started high at baseline and remained high during the pilot, suggesting the intended free bus passes that were originally planned for the pilot would have been a useful addition.
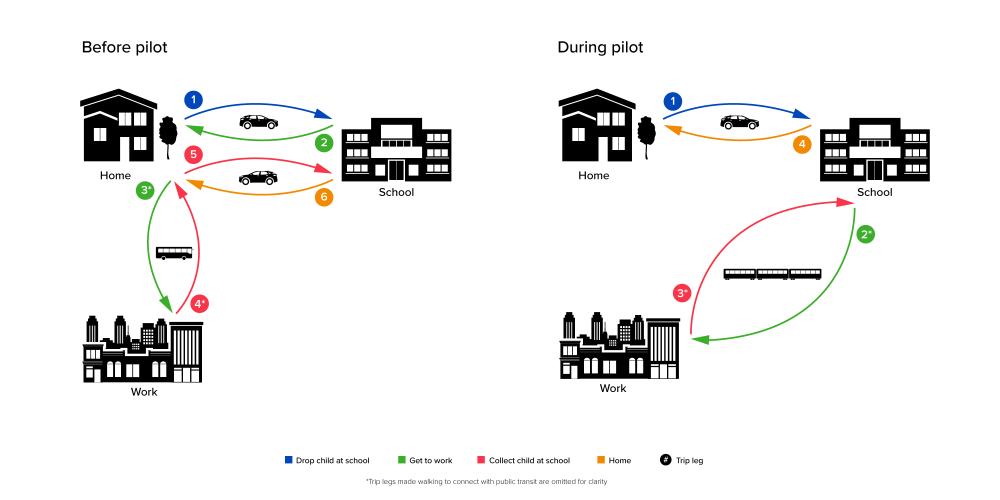
Table1. Mode Use during Bakersfield Pilot: Median Days per Week
| Before Pilot | During Pilot | |
|---|---|---|
| Ridehail | 1-2 days/week | 0/1-2 days/week |
|
Driving |
0 | 0 |
| Passenger | 0 | 0/1-2 days/week |
| Walking | 7 days/week | 3-4 days/week |
| Personal bike/scooter/skateboard | 0 | 0/1-2 days/week |
| Spin Bike | 0 | 5-6 days/week |
| Spin Scooter | 0 | 4 |
| Bus | 3-4/5-6 days/week | 5-6 days/week |
* differences significant at p < .05, two-tailed